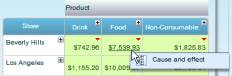
To find the root cause of the change in a cell value, click the cell and select Cause and effect.
Cause and Effect results display on the workboard in four “virtual” grids, presenting data from different perspectives broken down to different dimensions, and showing different Insights that might have contributed to the problem.
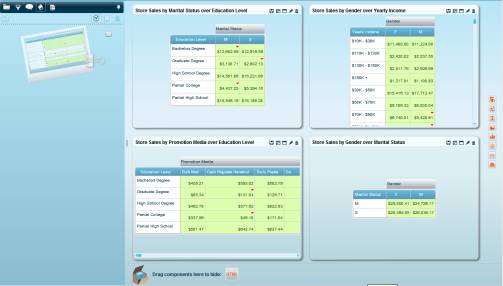
The original grid moves to the Scrapbook which has now opened on the Task Pane. From here you can drag it to the workboard.
Using the Undo
![]() or
Refresh
or
Refresh ![]() buttons returns you to the original
workboard.
buttons returns you to the original
workboard.
From the Cause and Effect results, you can continue your investigation further by using Cause and Effect on the highlighted data.