The KPI component is a special type of view component that presents information via KPIs that are easy to examine.
KPI views are defined in Panorama NovaView Analytics Client. To add a KPI component to your workboard, you need to add a view component and choose the relevant KPI view via the View Wizard.
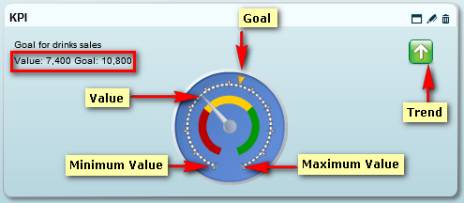
KPIs are snapshots of a business or organization, which are based on specific predefined measures. Every KPI has a goal value that may change over time. The actual value of the KPI is compared to the goal value to determine how much progress has been made towards achieving the goal. The trend value shows performance as compared to another period.
While developing KPIs, target performance levels are defined and the best way to represent variance from that target is determined. For example, a traffic light image for a sales KPI may flag regions that are under quota in red while those that are at quota are yellow and over quota are green. This allows you to view a company's strengths and possible areas for improvement at a glance.
KPIs may appear in the grid cells, in hierarchic tree format, or directly in the component arranged in rows and columns, depending on how they have been defined in Panorama NovaView Analytics Client.
In the following example, the KPI is presented directly in the component, using the gauge image.
The KPI component behaves in the same way as a regular view component. However, the Layout and Save options are not available for this component type.