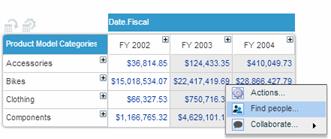
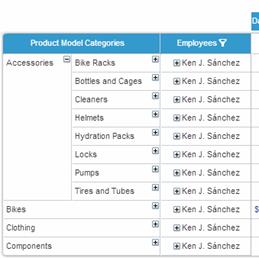
When the data source (OLAP cube or Necto model) of a view contains columns of “person” type (employees, users, resellers, store managers, etc.), the Find People option can be used to retrieve a list of all the people associated with a grid cell or grid column. For example, you may want to know who to contact regarding exception data in a grid cell. The Find People option activated from that cell will bubble up the related people in hierarchic tree format, as well as in a radar chart, as illustrated in the following example.
You can perform all or some of the following functions for a person in the list, depending on the group to which that person belongs:
· Start a discussion
· Send an e-mail message
· Show the person on the grid
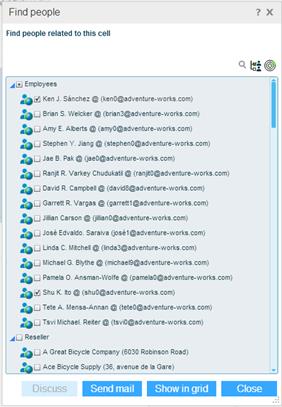
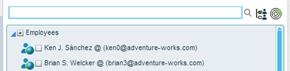
The icon next to a person’s name indicates the group to which that person belongs. Each person belongs to one of the following three groups:
![]() Necto users within the organization’s intranet. You can apply all of the three functions to people in this group.
Necto users within the organization’s intranet. You can apply all of the three functions to people in this group.
![]() Employees of the organization who are not Necto users. These people will automatically become Necto users when you start a discussion with them. You can apply all of the three functions to people in this group.
Employees of the organization who are not Necto users. These people will automatically become Necto users when you start a discussion with them. You can apply all of the three functions to people in this group.
![]() People who are not in the organization’s intranet. You can send e-mail messages to these people and show them on the grid, but you cannot start a discussion with them.
People who are not in the organization’s intranet. You can send e-mail messages to these people and show them on the grid, but you cannot start a discussion with them.
To find people and apply a function:
1. Click on a grid cell and select Find People from the context menu. To find people for an entire grid column, select Find People from that member’s menu.
2. The results display in the Find People dialog box, in a radar chart or in hierarchic tree format.
To switch from radar chart to hierarchic tree format, click the Show Users Tree ![]() button.
button.
3. In the users tree, select or deselect the people you want to communicate with or display on the grid. Selecting/deselecting a parent entity selects/deselects the descendant entities.
4. To start a discussion with the selected people, click the Discuss ![]() button. A new discussion opens in the discussion panel.
button. A new discussion opens in the discussion panel.
To send mail, click the Send Mail ![]() button. Microsoft Outlook opens automatically with the email addresses of the selected recipients, the name of the workboard as the subject, and the link to the workboard in the message body. You can edit the mail message and send it.
button. Microsoft Outlook opens automatically with the email addresses of the selected recipients, the name of the workboard as the subject, and the link to the workboard in the message body. You can edit the mail message and send it.
To display the selected people in the grid, click the Show in Grid ![]() button. Only people from the same hierarchy level can be displayed in the grid.
button. Only people from the same hierarchy level can be displayed in the grid.
At the top of the Find People dialog box is a search box for searching people in the list. Necto dynamically presents the possible matches as you type in a search term in this box.
To clear the search results, delete the text in the search box.
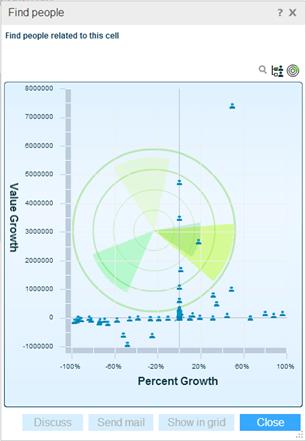
The Radar option shows the people plotted in a radar chart where the X-axis represents value growth and the Y-axis represents percent growth. It presents each person’s contribution to the data (increase or decrease by value).
The Radar option is available when there is a time dimension on the grid or grid data is sliced by a time dimension.
To switch from tree format to radar chart, click the Show Radar ![]() button.
button.
Pointing to a person on the radar chart shows the person’s name and the relevant contribution values.
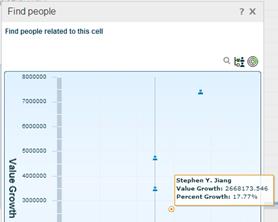
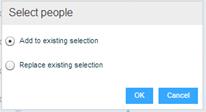
Clicking on a person on the radar chart, displays the hierarchic tree format with that person selected. Clicking on an additional person on the radar chart, opens a dialog box for either adding that person to the existing selection or replacing it.