To show One-Click Insights:
Click ![]() on the Workboard Bar. Indicators will immediately display on data cells based on the default condition <-5%: “difference in values that is greater than -5%”.
on the Workboard Bar. Indicators will immediately display on data cells based on the default condition <-5%: “difference in values that is greater than -5%”.
To define a different condition:
Click ![]() and choose an operator. Then, click
and choose an operator. Then, click ![]() and use the slider to set the threshold. You can also click on the number and enter it manually.
and use the slider to set the threshold. You can also click on the number and enter it manually.
![]()
For example, >50% to look for a change of more than 50% or <50% for a change of less than 50%.
Choose the time frame for comparison: ![]() for previous period (default) or
for previous period (default) or ![]() for the parallel period.
for the parallel period.
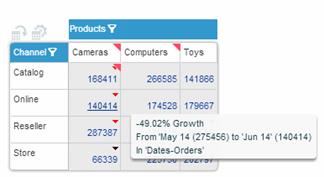
Insight indicators are green up-triangles for positive change and red down-triangles for negative. Tooltips provide explanations for the highlighting.
To hide One-Click Insights:
Click ![]() on the Workboard Bar.
on the Workboard Bar.
To filter data by Insights:
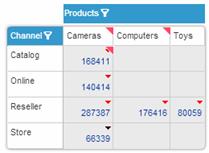
Click the Insights Filter ![]() button to hide the columns and rows that do not have highlighted values so that you can focus on the most relevant data at this point of your analysis. Note that this action also hides the regular exception indicators from cells that were marked also by Insights.
button to hide the columns and rows that do not have highlighted values so that you can focus on the most relevant data at this point of your analysis. Note that this action also hides the regular exception indicators from cells that were marked also by Insights.
Clicking the button again returns the hidden columns and rows.