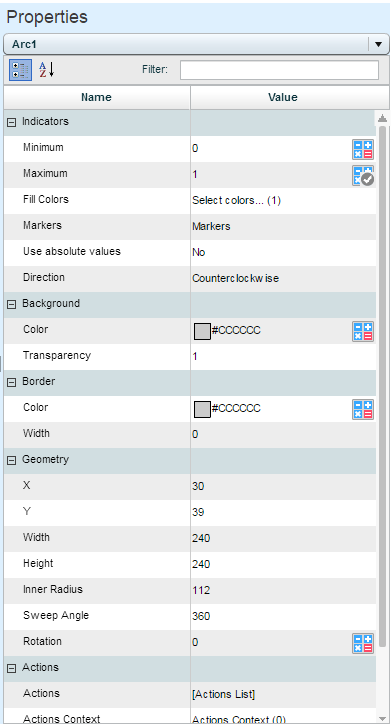
From the dropdown list at the top of the Properties Pane, select the arc object whose properties you want to define.
The arc object has the same properties under the Indicators category as the image object. In addition, it has the following property:
Markers
You can add markers to enhance the information displayed by the graphic object.
Click on the Value column and then on the down arrow.

Click on the blank row and specify the marker settings: In Value, enter the value that the marker should mark. If this is a percentage value, select the check box.
![]()
You can use the Data Link ![]() option to define a rule or an MDX statement that will return the value.
option to define a rule or an MDX statement that will return the value.
In Type, select the marker to display. Then, define its color, border, position and size. You can use the Data Link ![]() option to control the fill color and the color of the border.
option to control the fill color and the color of the border.
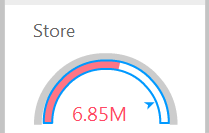
In the following example, the triangle arrow marker is used to denote previous quarter sales.
Color
Click to open the palette and choose a color for the object’s background. Or, use the Data Link ![]() option.
option.
Transparency
If the background should be transparent, set the transparency value.
Color
Click to open the palette and choose a color for the object’s border. Or, use the Data Link ![]() option.
option.
Width
The width of the border line.
X,Y
The position of the object.
Width, Height
The width and height of the object.
Inner Radius
The size of the inner radius of the arc.
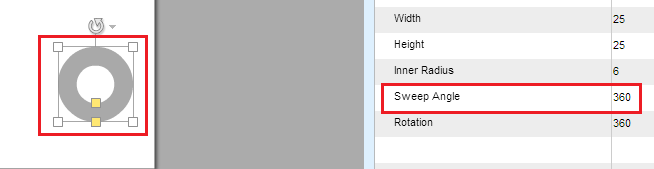
Sweep Angle
The angle of the arc.

The larger the angle the closer the arc will be to a circle. 360 is a full circle.
Rotation
If the object should be rotated, specify the value of rotation in degrees.
The arc object has the same properties under the Actions category as the Text object.