You can display data using both a bar chart and a line chart for different members of the view:
1. On the View tab of the ribbon, click Chart Type ![]() and select one of the bar chart types.
and select one of the bar chart types.
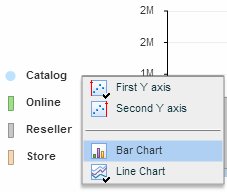
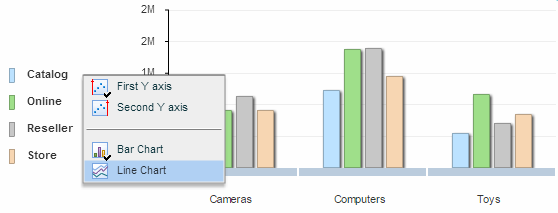
2. In the chart legend, click ![]() next to the member you wish to represent by means of a line chart. From the chart member menu, select Line Chart.
next to the member you wish to represent by means of a line chart. From the chart member menu, select Line Chart.
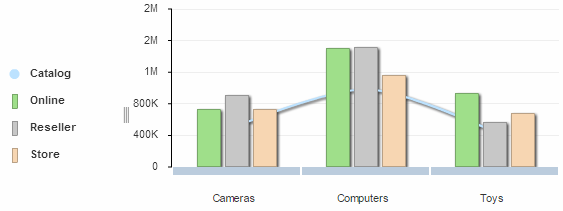
The selected member is now represented by means of a line chart.
To return the member to bar chart:
Open the chart member menu in the legend, and select Bar Chart.