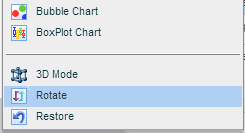
By default, the chart engine plots the vertical axis of the grid as the data series and the horizontal axis of the grid as the values. Use the Rotate option on the chart menu to rotate the chart axes.