You can use the Layout ![]() option on the View tab of the ribbon to choose a layout for displaying the data in the selected view component:
option on the View tab of the ribbon to choose a layout for displaying the data in the selected view component:
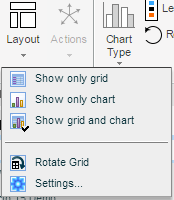
The grid is the main work area where you explore and analyze the view data. It displays data in a grid with two axes (rows and columns), on which you can place two or more dimensions from the data source.
The chart is a graphical representation of the same data you see in the grid.
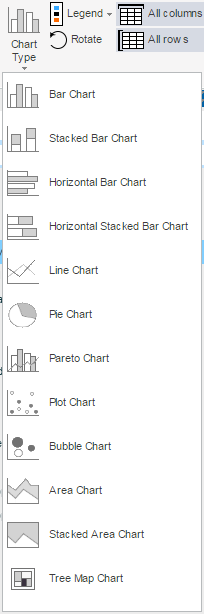
When you choose this layout or the Show Grid and Chart layout, you can use the Chart Type ![]() option to choose chart types.
option to choose chart types.
You can use the Chart Colors ![]() option on the Format tab of the ribbon to display the chart according to a color template.
option on the Format tab of the ribbon to display the chart according to a color template.
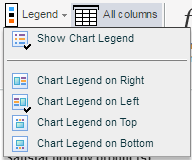
The Legend ![]() option on the View tab of the ribbon enables you to show and hide the chart legend and change its position.
option on the View tab of the ribbon enables you to show and hide the chart legend and change its position.
When both the grid and the chart are displayed, you can resize these areas by dragging the boundary between them.
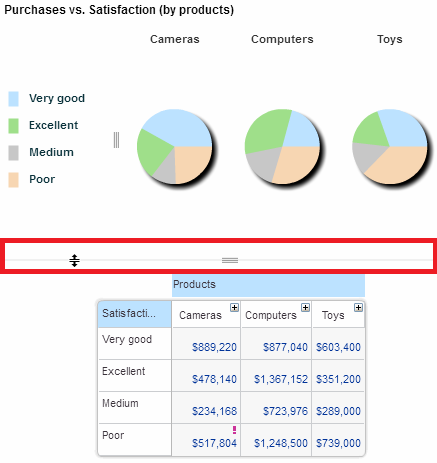
Use the Chart Type, Chart Colors and Legend options in the same way as in the Only Chart layout.