You can apply infographics to the entire grid or to specific columns or rows.
To apply infographics:
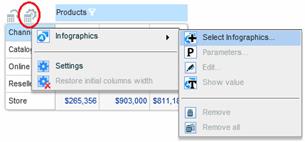
1. To apply infographics to all the cells, select Infographics > Select Infographics from the Settings menu.
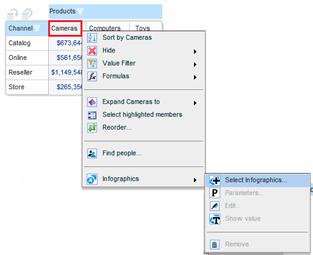
To apply infographics to the cells of a column or row in the grid, select Infographics > Select Infographics from the relevant member menu.
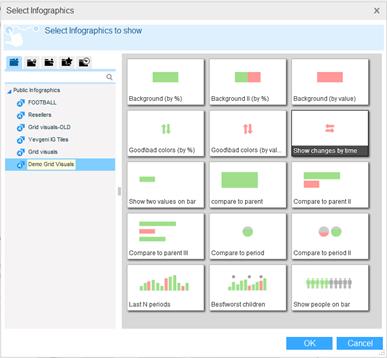
2. In the Select Infographics dialog box, select an infographics family. Then, from the preview pane select the infographics entity you want to apply. Note that tooltips display full descriptions including explanations on how to use the infographics.
Click OK.
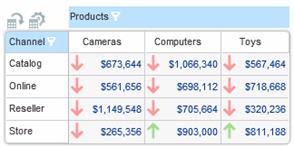
3. The infographics appear in the data cells.
To hide cell values, select Infographics > Show Value.
To set conditions, thresholds and other parameters, select Infographics > Parameters.