
After saving a new infographics family, the Infographics Designer opens with three panes.
On the right is the Properties Pane. From the dropdown select Infographics family, and define the family properties. During your work or at the end, click the Save ![]() button on the Application Bar to save the definitions.
button on the Application Bar to save the definitions.
The full name of the infographics family.
In the edit box that opens you can enter a detailed description for the family.
This property is used to define the parameters that can be used in all the Data Links of the family’s infographics entities.
Click on the Parameters value column and then click ![]() to open the Parameters window.
to open the Parameters window.

To define a parameter:
1. Click the Add ![]() button to open a new tab, and choose the type of parameter you want to define.
button to open a new tab, and choose the type of parameter you want to define.

2. Enter the parameter definitions as described in the following sections.
3. To add another parameter, repeat the steps above.
4. Click OK.
To work with the options of the Parameters window:
· Point to a parameter tab to display a tooltip with the name of the parameter, its type and current value.
· To show/hide a parameter definition, use the up/down arrow on the tab.
· To delete a parameter, click the Delete button on the parameter tab.
· To move a parameter up or down the list, click the Move Up or Move Down arrow on the parameter tab.
· To disable a parameter definition so that it does not appear in the Data Link window for selection, deselect the checkbox on the parameter tab.
· To reorder the parameters, click ![]() . In the Reorder window, drag the parameters up or down, or use the up and down arrows to the right.
. In the Reorder window, drag the parameters up or down, or use the up and down arrows to the right.

This option is used to define a numeric range from which a value can be selected.

Name
Enter a name for the parameter. You will use this name when embedding this parameter in a formula or as a placeholder. If you don’t enter a name, the parameter name will be “Numeric 1”.
Title
The name that will appear as the title of the parameter. Use # as a placeholder for the value.
![]()
If you don’t enter a caption, the default title “Numeric 1” will appear.
Initial Value
Specify the value that should be the initial selection for the parameter.
Minimum – Maximum
The lowest and highest values in the numeric range.
Step
The number of counts to move at every slide or click when selecting a value.
Format
The display format for numbers. For example, #,##0.
Visualization
Specify the type of control to be used for selection. Slider and Number Stepper are the suitable controls for this type of parameter.
The following is an example for Number Stepper:

Advanced Visualization - Slider Labels
Click the ![]() button to open the Advanced Visualization window.
button to open the Advanced Visualization window.

In Slider Labels, choose an option to specify how you want the slider labels to appear. Auto means Necto will display the labels automatically. Choose All to display labels for all the steps, or None not to show any labels. To display a label, for example, every 2 steps, choose Every 2.
This option is used to define a list of values from which the user can select a value.

Name
Enter a name for the parameter. If you don’t enter a name, the parameter name will be “Pick List 1”.
Title
The name that will appear as the title of the parameter. Use # as a placeholder for the selected value.
List Values
You build the list of values in this table by:
· Clicking the Add ![]() button and entering a name and a value in each row.
button and entering a name and a value in each row.

· Clicking the Add Image ![]() button and selecting an image from the image library.
button and selecting an image from the image library.

· Clicking the Add Color ![]() button and selecting a color from the palette.
button and selecting a color from the palette.
· Clicking the Add Cell ![]() button and selecting cell coordinates (by selecting members).
button and selecting cell coordinates (by selecting members).
· Clicking the Add Set ![]() button and selecting a set of members.
button and selecting a set of members.
To remove a row from the list, select it and click ![]() .
.
Use the Reorder ![]() option to move the items on the list to other positions.
option to move the items on the list to other positions.
Selection Type
Specify the type of selection allowed for this parameter:
· Single value: A single value can be selected.
· Multiple values: Several values can be selected using Ctrl-click or Shift-click.
Initial Value
The value that should be the initial selection.
Visualization
Specify the type of control to be used for selection: Drop Down, List, Selection Group, Selection Group (buttons),Slider.
This option is used to define a text control where the user can enter free text.

Name
Enter a name for the parameter. If you don’t enter a name, the parameter name will be “Text 1”.
Title
The name that will appear as the title of the parameter. Use # as a placeholder for the selected value.
Initial Value
The string that should display as the initial value.
Numeric
Select this check box to allow only a numeric value in the text control.
This option is used to define an MDX statement that will return the parameter value.

Name
Enter a name for the parameter. If you don’t enter a name, the parameter name will be “MDX 1”.
Title
The name that will appear as the title of the parameter. Use # as a placeholder for the selected value.
Edit MDX
Click the Edit MDX button and enter the MDX statement in the editing box. Click OK.

This option enables you to choose a specific data cell by selecting a member from Measures, in addition to members from the relevant dimensions.

Enter the Title and a Description.
Click on the Member column and select the relevant measure (or Current measure) or dimension member.

Set Visible to Yes so that the parameter will be available for editing to end-users, via the Infographics Parameters option on the workboard page ribbon.
This option is used to define a parameter based on a condition.

Enter the parameter Name and a Title.
Choose the Relation and the relevant Number (e.g. <0)
This option is used to define a color as a parameter.

Enter a Name and a Title. Choose the Color from the palette.
This option is used to define an image as a parameter.

Enter a Name and a Title. Click the Image button to open the image library and choose the image.
This property is used to generate animation by switching among the infographics entities of the family.
Click on the value column and then click ![]() to open the Infographics Animation window.
to open the Infographics Animation window.

Select an Effect and the Direction of the movement. Set the Frequency in seconds.
Select the entities that should participate in the animation. The Preview pane will show the results.
Click OK.
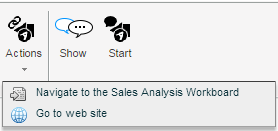
This property is used to define actions that will be available for execution from each infographic entity in this family, by clicking the Actions ![]() button on the Infographics tab of the ribbon in a workboard.
button on the Infographics tab of the ribbon in a workboard.
To define actions:
1. Click on Actions List and then click the down arrow.

2. Click the Create ![]() button and click on the value column. From the dropdown list, select an action.
button and click on the value column. From the dropdown list, select an action.
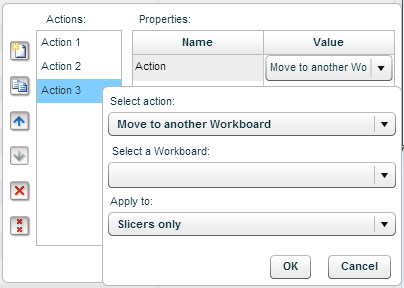
Move to another workboard
Clicking on the action will move the user to the workboard defined in this property.
Choose Move to another workboard, and in Select a Workboard choose the workboard to navigate to.
Click OK.
Open a browser window
Clicking on the action will open the specified web page in a browser window.
Choose Open a browser window, and in Enter page URL type in the page address.
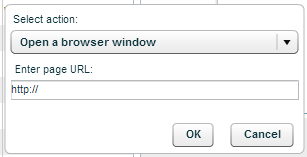
Click OK.
Execute a JavaScript expression
Clicking on the action will execute the entered JavaScript code.
Choose Execute a JavaScript expression.
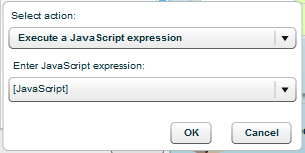
Click the arrow in Enter JavaScript expression and type in the code.
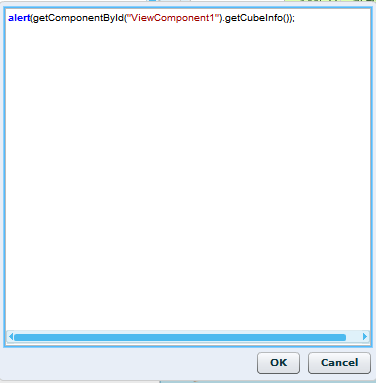
Click OK.
3. In Caption, the action’s caption appears automatically. This caption appears in the action’s tooltip. Click on it to edit it.
4. Click OK.
This property is used to select dimensions for slicing the entities of the infographics family.
Click on Select dimensions… and then click ![]() to open the dimension selection window.
to open the dimension selection window.

The pane on the left shows the dimensions of the data source. The Infographics Dimensions pane shows the dimensions of the infographics.
The ![]() icon indicates that the dimension is included in the Infographics Dimensions pane.
icon indicates that the dimension is included in the Infographics Dimensions pane.
The ![]() icon indicates that the dimension is not included in the Infographics Dimensions pane.
icon indicates that the dimension is not included in the Infographics Dimensions pane.
You can add and remove dimensions using the Add/Remove arrows.
The Topics property is used to tag the infographics family with topics that best describe its content. This is similar to using the Workboard Topics option.
Click on Select topics… and then click ![]() to open the topics dialog box.
to open the topics dialog box.

This property contains the details of the connected data source, and enables you to modify the connection.
Click on the value and then click ![]() to open the data source connection dialog box, and perform the necessary connection modifications.
to open the data source connection dialog box, and perform the necessary connection modifications.
